
Appearance
Analytics
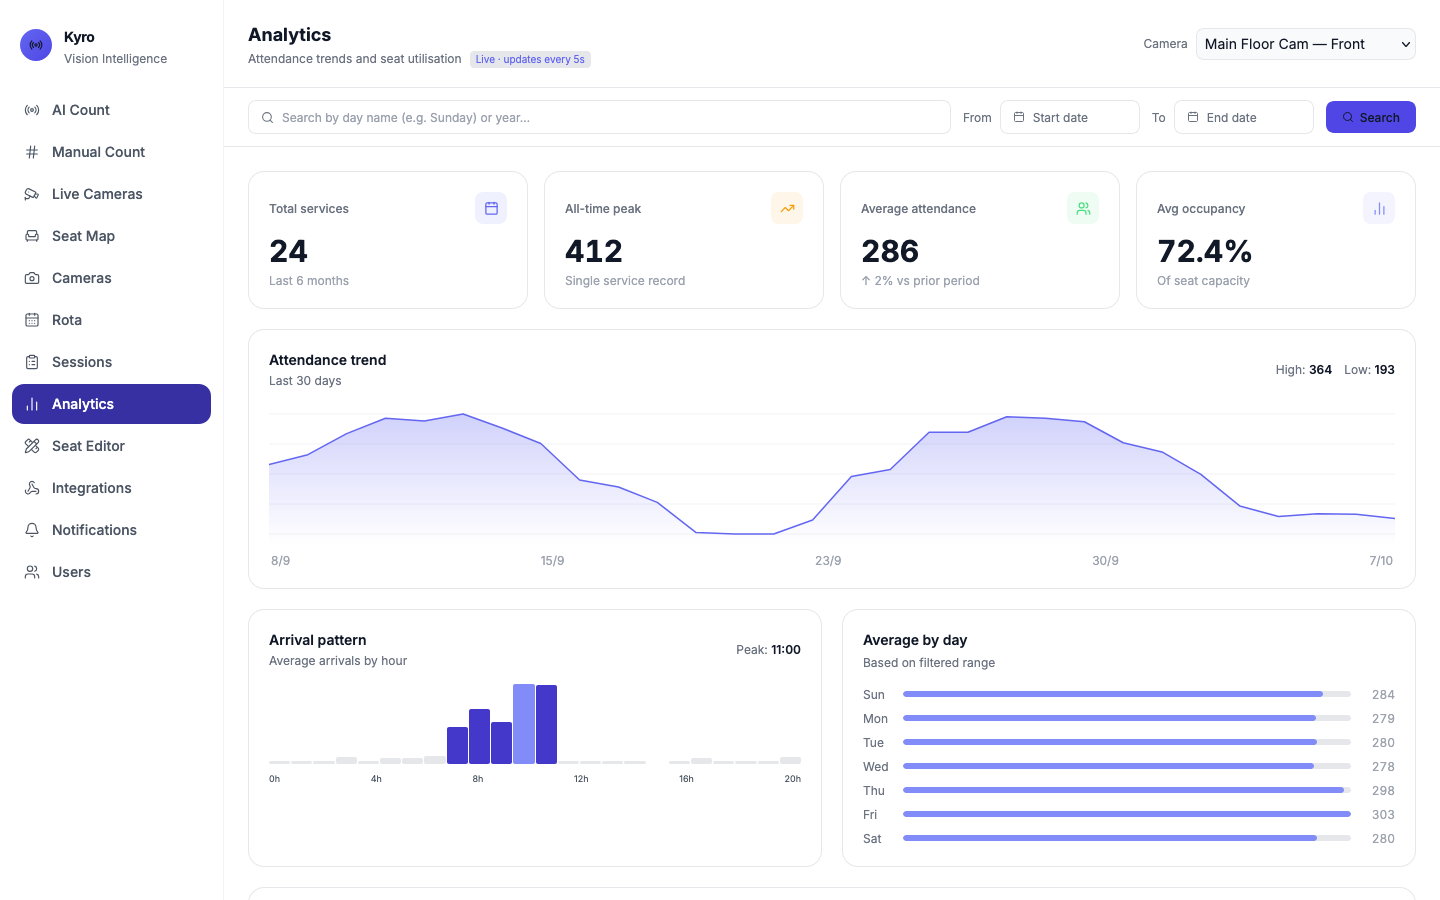
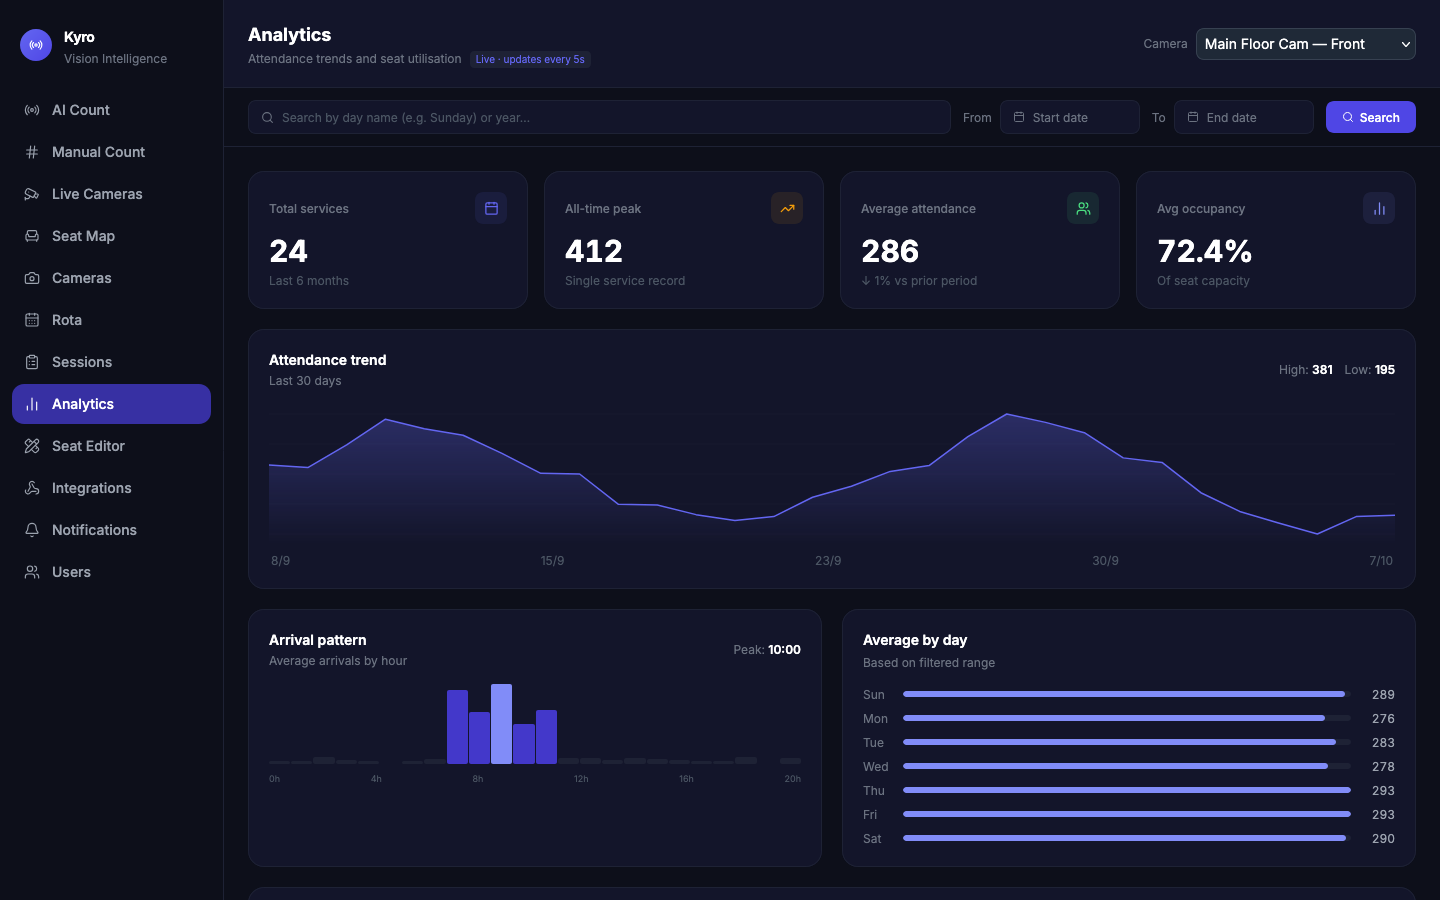
Analytics shows attendance over time: totals, peaks, averages, your busiest days and when people tend to arrive.
Choose a camera
Analytics shows one camera at a time. Use the Camera menu at the top right to switch rooms.
The summary
| Box | Shows |
|---|---|
| Total services | Services recorded in the period |
| All-time peak | The highest single-service attendance |
| Average attendance | The average, and whether it's going up or down compared with the period before |
| Avg occupancy | How full the room is on average |
Charts
- Attendance trend: attendance for each day, with the high and low.
- Arrival pattern: average arrivals by hour, with the Peak hour.
- Average by day: your average for each day of the week.
- Recent services: the latest 10, with date, day, attendance and occupancy.
Filter
- Only Sundays: type Sunday in the search box.
- A date range: set From and To. Tap Clear to reset.
When filtered, you'll see Showing X of Y days.
Look at one service
Tap any row in Recent services to open its details: attendance against your 30-day average, occupancy, and how it compared with the same day last week. Close it with ×.
Manual counts aren't included here
Analytics uses camera counts only. For today's total including manual counts, use AI Count.