
Appearance
AI Count
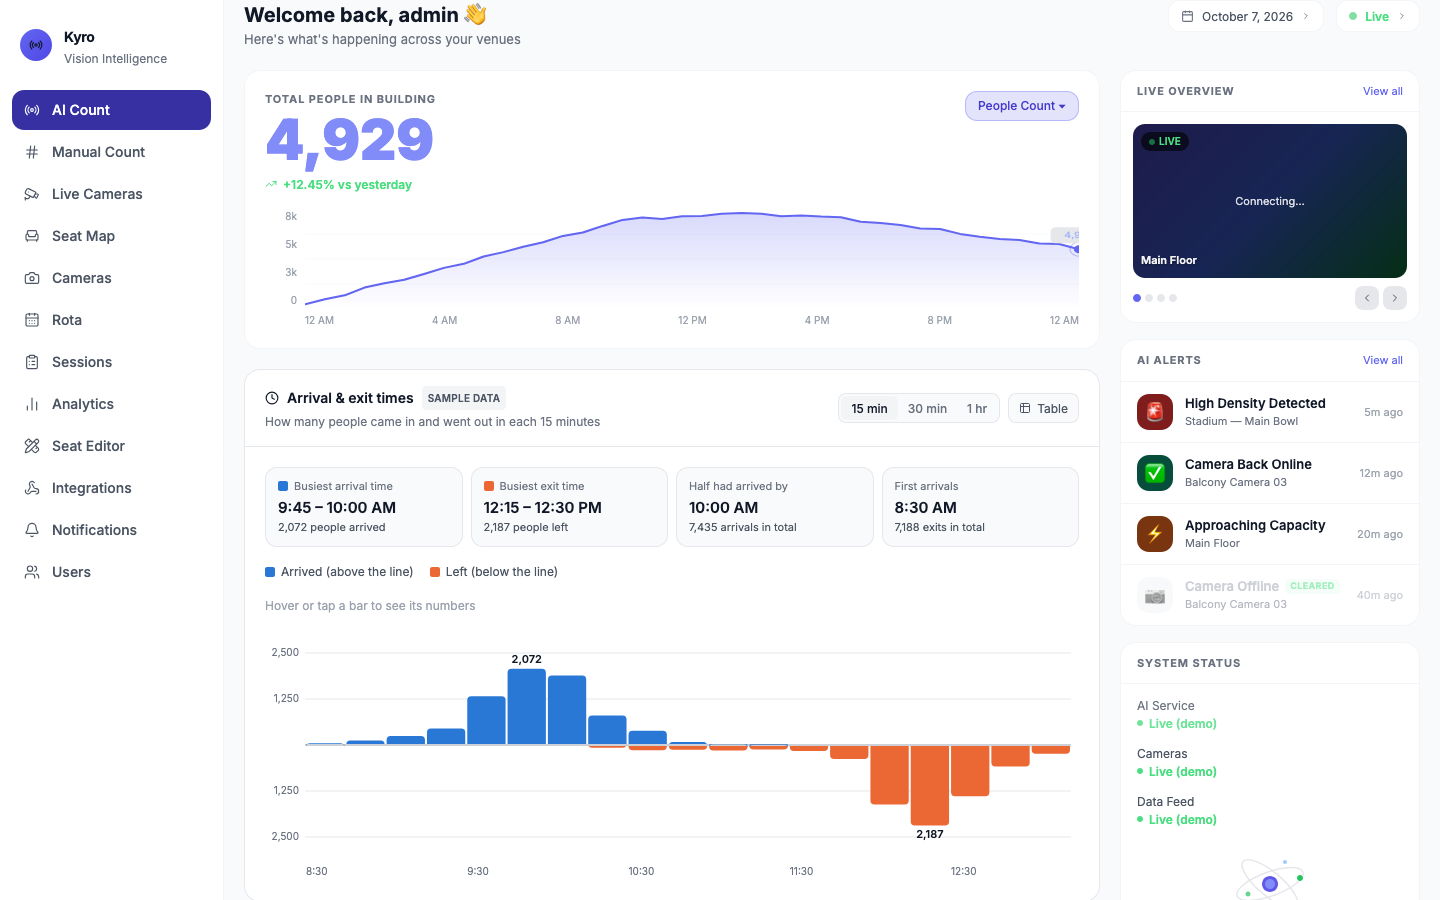
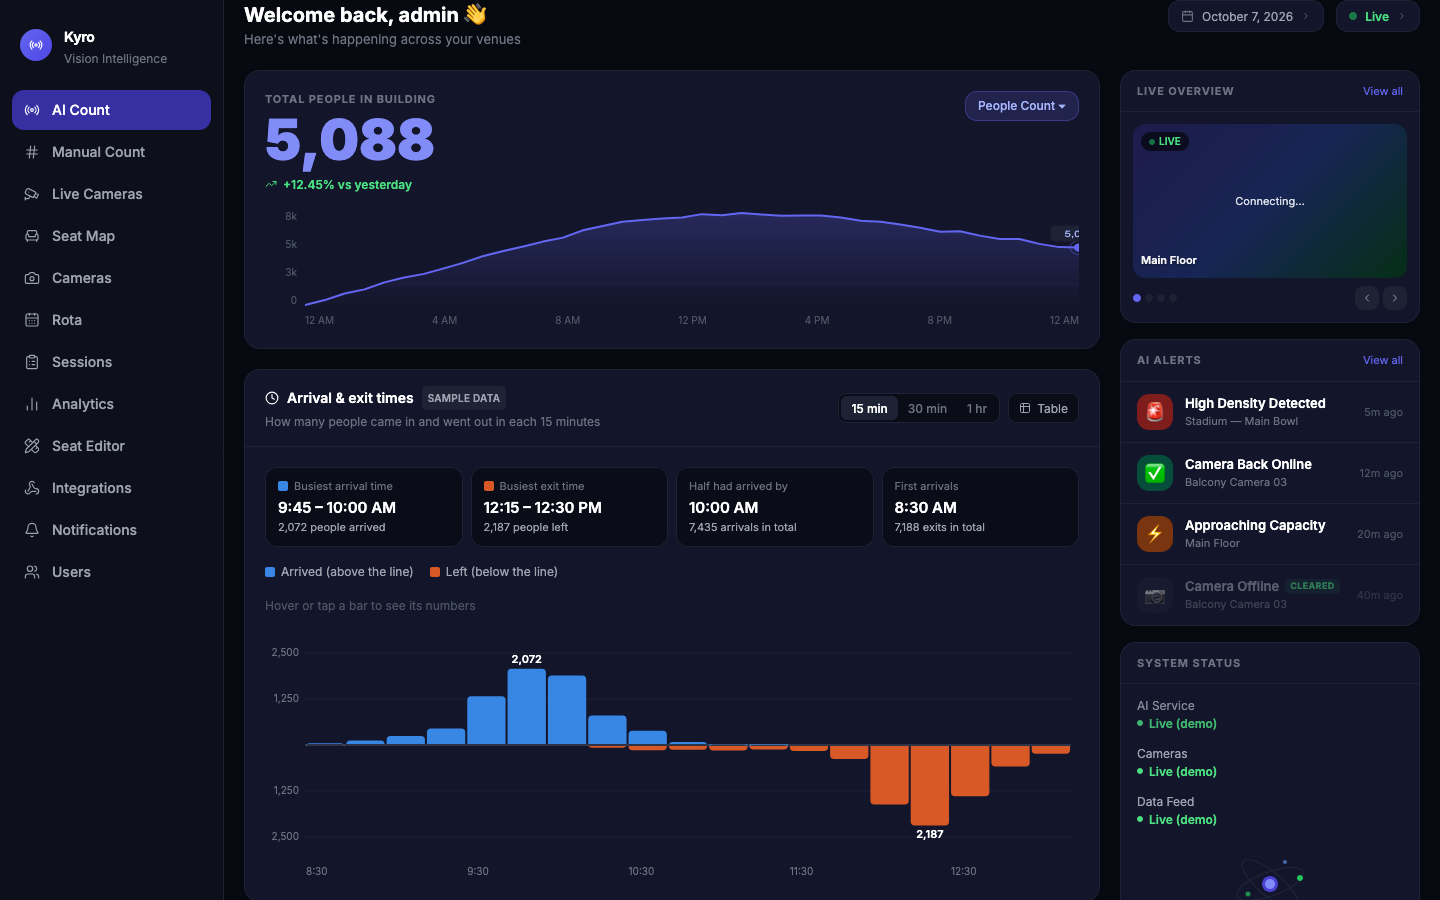
AI Count is the main dashboard. It shows how many people are in the building, how that changed through the day, when people arrived and left, and the health of the system.
The headline number
Total people in building is the big number at the top. On any day other than today it shows that day's figure and reads Historical data.
Admins and operators can switch what the number and chart show with the button at the top right of the card (People Count ▾):
| Option | Shows |
|---|---|
| People Count | People in the building now |
| Occupancy % | How full the venue is |
| Entries | Total entries today |
| Exits | Total exits today |
Manual counts are included
For People Count and Entries, today's approved manual counts are added to the camera count. Drafts aren't added until they're approved.
Look at another day
- Tap the date button at the top right (for example October 6, 2026).
- Pick Today, Yesterday, 7 days ago or 30 days ago, or choose any past day from Custom date.
Arrival & exit times
This card answers "when do people arrive?" Blue bars above the line are people arriving, and orange bars below the line are people leaving, for each time slot.
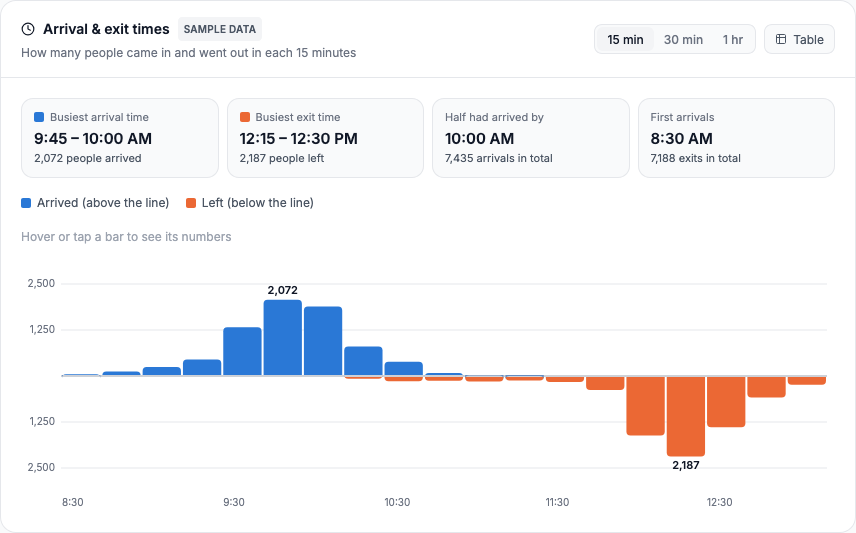
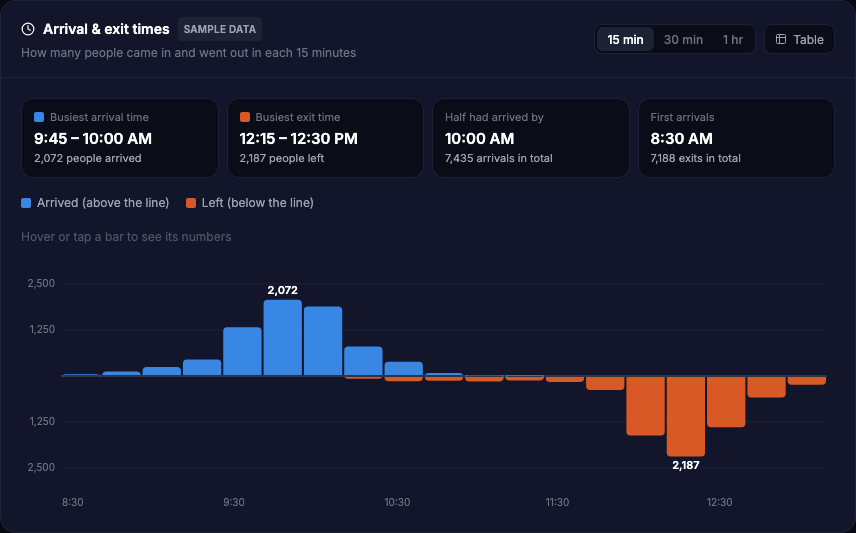
- The four boxes give the answers straight away: Busiest arrival time, Busiest exit time, Half had arrived by and First arrivals.
- Switch between 15 min, 30 min and 1 hr slots.
- Hover over or tap a bar to see its numbers just above the chart.
- Tap Table to see every slot as a list of times with Arrived and Left.
Use it to plan
If half your congregation arrives in the 15 minutes before the service starts, that's when you need the most ushers at the doors.
Arrival times come from the cameras' entry and exit counts. Without the camera system connected, the card says so instead of showing numbers. In Demo mode it shows Sample data.
Zone Overview and Detailed Zone Analytics
Zone Overview has a card for each room with a camera, showing people now and a small trend line. Detailed Zone Analytics (admins and operators) lists each zone with Now, Peak and Trend (Today). Tap any zone to open it on the Seat Map.
Right-hand column
- Live Overview: a slideshow of camera pictures. Use the arrows or dots to move between cameras, or View all to open Live Cameras.
- AI Alerts (admins and operators): recent alerts like High Density Detected or Camera Offline. Resolved alerts fade and show CLEARED.
- System Status (admins only): whether each part of Kyro is really working.
Reading System Status
| Row | What it checks | You might see |
|---|---|---|
| AI Service | Whether the Kyro server answers | Live · Offline · Not connected |
| Cameras | How many cameras are running | Live (3 of 3) · 2 of 3 live · Offline (0 of 3) · None set up |
| Data Feed | Whether counts arrived in the last 20 seconds | Live · Not updating · No data |
Green means working, amber means partly working, red means down, and grey means not connected. In Demo mode every row reads Live (demo).